⏱️ Understanding GatewayEvent Durations in Otoroshi
Otoroshi exposes a detailed set of timing metrics through the GatewayEvent object. These durations provide a precise view of where time is spent during the lifecycle of an HTTP request, from the gateway perspective.
This document explains: - what each duration represents, - how they relate to one another, - and how to correctly interpret them when analyzing latency or performance issues.
What is a GatewayEvent?
A GatewayEvent is emitted by Otoroshi for each processed request. It contains metadata about the request and response, as well as a fine-grained breakdown of durations measured from Otoroshi’s point of view.
Example (shortened):
{
  "@id": "2000958908838969946",
  "@type": "GatewayEvent",
  "@timestamp": 1765900754543,
  "reqId": "2000958908641837657",
  "duration": 47,
  "overhead": 33,
  "cbDuration": 0,
  "requestStreamingDuration": 0,
  "responseStreamingDuration": 1,
  "backendDuration": 12,
  "backendResponseStreamingDuration": 1,
  ...
}
All durations are expressed in milliseconds.
Global Request Flow
The lifecycle of a request in Otoroshi can be summarized as:
- The client sends the HTTP request to Otoroshi
- Otoroshi performs request-side processing (routing, security, plugins, etc.)
- The request is forwarded to the backend (possibly with retries)
- The backend processes the request and sends the response headers
- The response body is streamed back through Otoroshi to the client
The following sequence diagram represents a very simplified version of the reference flow used for all durations described in this document:
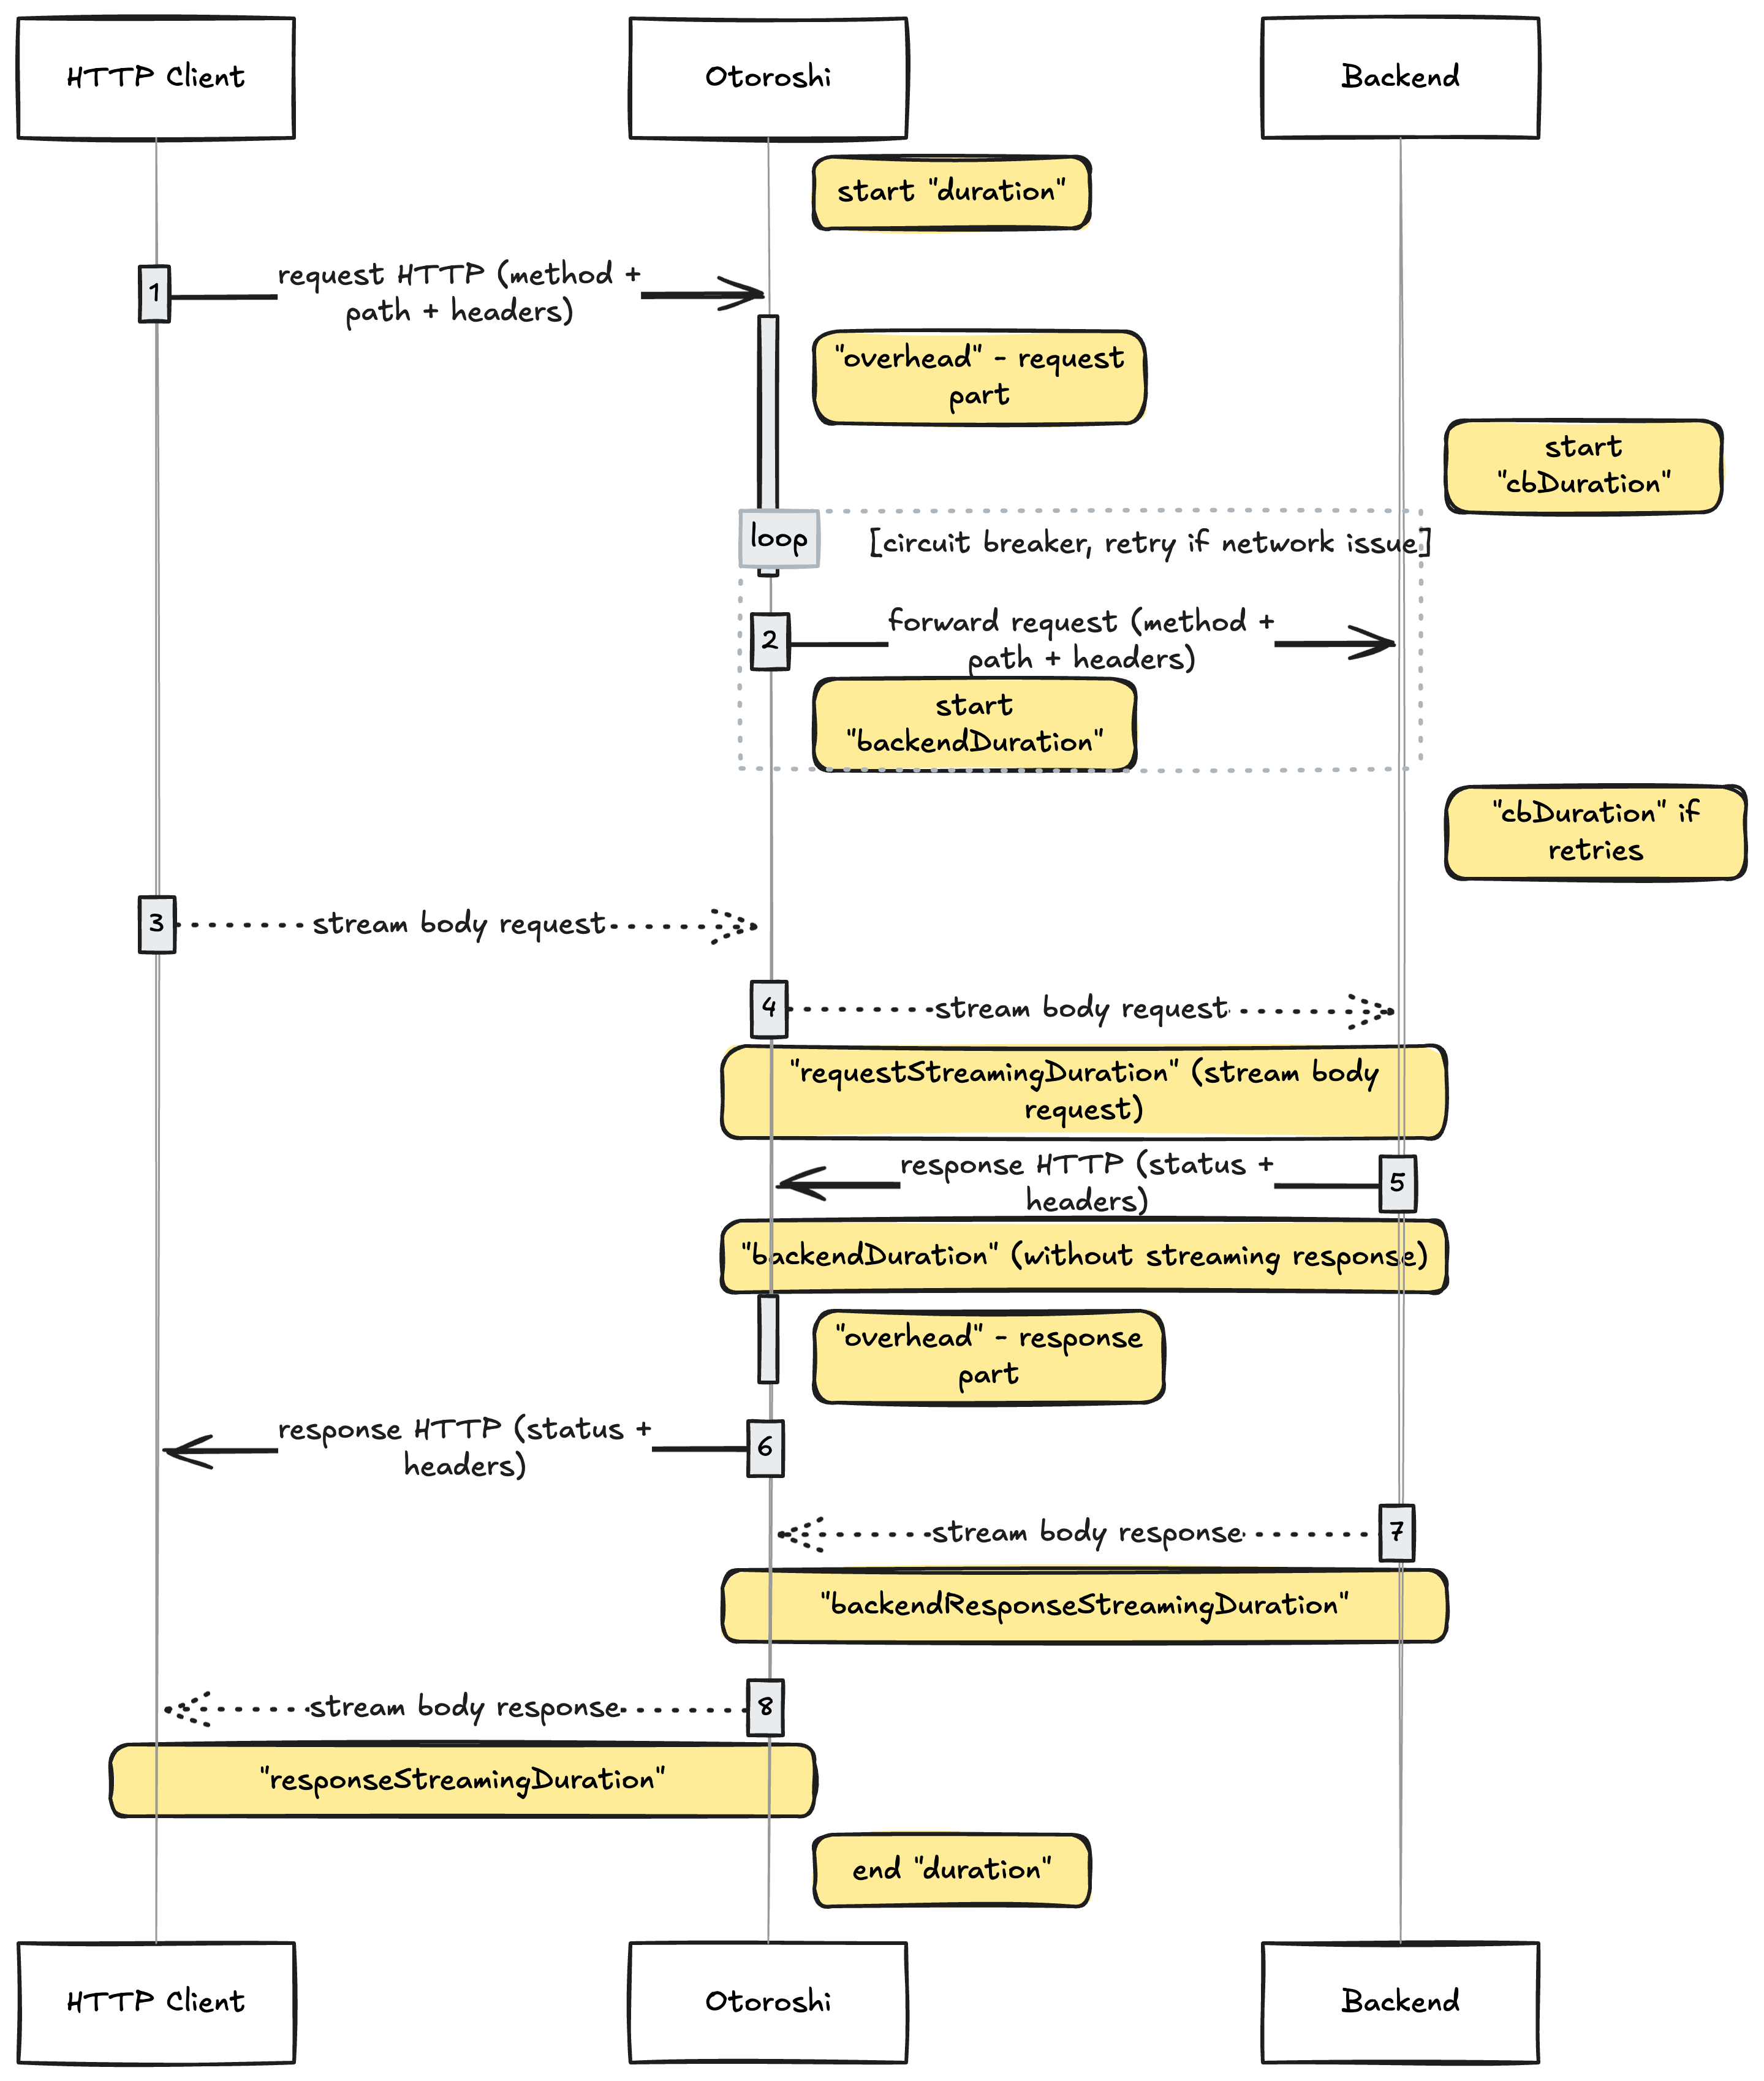
This diagram should be used as the mental model when interpreting GatewayEvent durations.
Duration Fields Explained
duration
Total request duration, in milliseconds.
This represents the full end-to-end duration of a request as seen by Otoroshi: from the moment the first byte of the request is received, to the moment the last byte of the response is sent back to the client.
It includes:
- Otoroshi internal processing
- circuit breaker retries
- backend processing
- request and response streaming
This is the most global and user-visible latency metric.
overhead
Otoroshi internal processing time, in milliseconds.
This duration corresponds to all the time spent inside Otoroshi itself, on both the request and response paths.
It includes:
- service matching and routing
- authentication and authorization
- quotas and rate limiting
- circuit breaker decision logic
- execution of plugins (pre, transform, post)
- internal bookkeeping and metrics
It does not include:
- backend execution time
- streaming of request or response bodies
This metric is particularly useful to:
- understand the cost of plugins
- evaluate the impact of advanced gateway features
cbDuration
Circuit breaker retry duration, in milliseconds.
This duration measures the extra time spent performing retries due to the circuit breaker.
Important notes:
- It is
0if no retry occurs - It only accounts for retry attempts, not the initial backend call
- It increases with the number of retries and retry delays
A high cbDuration often indicates:
- unstable backends
- aggressive retry policies
- hidden latency caused by retry mechanisms
backendDuration
Backend processing duration, in milliseconds, excluding response body streaming.
This measures the time between:
- the moment Otoroshi forwards the request to the backend
- and the moment it receives the response headers
It includes:
- network latency to the backend
- backend application processing time
It explicitly excludes:
- streaming of the response body
This is the primary metric to evaluate backend latency.
backendResponseStreamingDuration
Backend → Otoroshi response body streaming duration, in milliseconds.
This measures how long it takes for Otoroshi to receive the full response body from the backend, starting after backendDuration completes.
This duration becomes significant when:
- responses are large
- responses are streamed or chunked
- backend connections are slow
requestStreamingDuration
Otoroshi → Backend request body streaming duration, in milliseconds.
This measures the time spent streaming the request body from Otoroshi to the backend.
Special behavior:
- A value of
-1means that Otoroshi did not actively stream the body - In that case, the body was streamed directly from the client to the backend
- This happens when no plugin buffers or inspects the request body
This metric is relevant for:
- large uploads
- request body inspection
- request transformation plugins
responseStreamingDuration
Otoroshi → Client response body streaming duration, in milliseconds.
This measures the time spent streaming the response body back to the client.
It depends on:
- response size
- client network latency
- client read speed
This metric helps distinguish:
- backend slowness
- gateway processing time
- client-side bottlenecks
How Durations Relate to Each Other
A simplified mental model is:
duration
├── overhead
├── cbDuration
├── backendDuration
│   └── backendResponseStreamingDuration
├── requestStreamingDuration
└── responseStreamingDuration
Important considerations:
- Some durations may overlap due to streaming
- Not all durations are always present or meaningful
-1values are expected and valid- All timings are measured from Otoroshi’s perspective
Practical Interpretation Guidelines
-
High
durationwith lowbackendDuration→ slow client or response streaming -
High
backendDuration→ backend performance issue -
High
overhead→ heavy plugin usage or complex gateway logic -
High
cbDuration→ retries masking backend instability -
High streaming durations → large payloads or slow networks
Conclusion
GatewayEvent durations provide a fine-grained, actionable view of request latency inside Otoroshi.
When combined with logs and analytics, they allow operators to:
- identify performance bottlenecks
- tune plugins and features
- diagnose backend or client-side issues
- operate Otoroshi confidently at scale
Always refer to the sequence diagram above when analyzing timings, as it defines the authoritative execution flow used by Otoroshi.