Events and analytics
Otoroshi is a solution fully traced : calls to services, access to UI, creation of resources, etc.
You have to use Elastic to enable analytics features in Otoroshi
Events
- Analytics event
- Gateway event
- TCP event
- Healthcheck event
Event log
Otoroshi can read his own exported events from an Elasticsearch instance, set up in the danger zone. Theses events are available from the UI, at the following route: https://xxxxx/bo/dashboard/events.
The Global events page display all events of GatewayEvent type. This page is a way to quickly read an interval of events and can be used in addition of a Kibana instance.
For each event, a list of information will be displayed and an additional button content to watch the full content of the event, at the JSON format.
Alerts
MaxConcurrentRequestReachedAlert: happening when the handled requests number are greater than the limit of concurrent requests indicated in the global configuration of OtoroshiCircuitBreakerOpenedAlert: happening when the circuit breaker pass from closed to openedCircuitBreakerClosedAlert: happening when the circuit breaker pass from opened to closedSessionDiscardedAlert: send when an admin discarded an admin sessionsSessionsDiscardedAlert: send when an admin discarded all admin sessionsPanicModeAlert: send when panic mode is enabledOtoroshiExportAlert: send when otoroshi global configuration is exportedU2FAdminDeletedAlert: send when an admin has deleted an other admin userBlackListedBackOfficeUserAlert: send when a blacklisted user has tried to acccess to the UIAdminLoggedInAlert: send when an user admin has logged to the UIAdminFirstLogin: send when an user admin has successfully logged to the UI for the first timeAdminLoggedOutAlert: send when an user admin has logged out from OtoroshiGlobalConfigModification: send when an user amdin has changed the global configuration of OtoroshiRevokedApiKeyUsageAlert: send when an user admin has revoked an apikeyServiceGroupCreatedAlert: send when an user admin has created a service groupServiceGroupUpdatedAlert: send when an user admin has updated a service groupServiceGroupDeletedAlert: send when an user admin has deleted a service groupServiceCreatedAlert: send when an user admin has created a tcp serviceServiceUpdatedAlert: send when an user admin has updated a tcp serviceServiceDeletedAlert: send when an user admin has deleted a tcp serviceApiKeyCreatedAlert: send when an user admin has crated a new apikeyApiKeyUpdatedAlert: send when an user admin has updated a new apikeyApiKeyDeletedAlert: send when an user admin has deleted a new apikeyCertRenewalAlert: sent when a certificate has been automatically renewedCertExpiredAlert: sent when a certificate has expiredCertAlmostExpiredAlert: sent when a certificate is almost expired
Audit
With Otoroshi, any admin action and any sucpicious/alert action is recorded. These records are stored in Otoroshi’s datastore (only the last n records, defined by the otoroshi.events.maxSize config key). All the records can be send through the analytics mechanism (WebHook, Kafka, Elastic) for external and/or further usage. We recommand sending away those records for security reasons.
Otoroshi keep the following list of information for each executed action:
Date: moment of the actionUser: name of the ownerFrom: IP of the concerned userAction: action performed by the person. The possible actions are:ACCESS_APIKEY: User accessed a apikeyACCESS_ALL_APIKEYS: User accessed all apikeysCREATE_APIKEY: User created a apikeyUPDATE_APIKEY: User updated a apikeyDELETE_APIKEY: User deleted a apikeyACCESS_AUTH_MODULE: User accessed an Auth. moduleACCESS_ALL_AUTH_MODULES: User accessed all Auth. modulesCREATE_AUTH_MODULE: User created an Auth. moduleUPDATE_AUTH_MODULE: User updated an Auth. moduleDELETE_AUTH_MODULE: User deleted an Auth. moduleACCESS_CERTIFICATE: User accessed a certificateACCESS_ALL_CERTIFICATES: User accessed all certificatesCREATE_CERTIFICATE: User created a certificateUPDATE_CERTIFICATE: User updated a certificateDELETE_CERTIFICATE: User deleted a certificateACCESS_CLIENT_CERT_VALIDATOR: User accessed a client cert. validatorACCESS_ALL_CLIENT_CERT_VALIDATORS: User accessed all client cert. validatorsCREATE_CLIENT_CERT_VALIDATOR: User created a client cert. validatorUPDATE_CLIENT_CERT_VALIDATOR: User updated a client cert. validatorDELETE_CLIENT_CERT_VALIDATOR: User deleted a client cert. validatorACCESS_DATA_EXPORTER_CONFIG: User accessed a data exporter configACCESS_ALL_DATA_EXPORTER_CONFIG: User accessed all data exporter configCREATE_DATA_EXPORTER_CONFIG: User created a data exporter configUPDATE_DATA_EXPORTER_CONFIG: User updated a data exporter configDELETE_DATA_EXPORTER_CONFIG: User deleted a data exporter configACCESS_GLOBAL_JWT_VERIFIER: User accessed a global jwt verifierACCESS_ALL_GLOBAL_JWT_VERIFIERS: User accessed all global jwt verifiersCREATE_GLOBAL_JWT_VERIFIER: User created a global jwt verifierUPDATE_GLOBAL_JWT_VERIFIER: User updated a global jwt verifierDELETE_GLOBAL_JWT_VERIFIER: User deleted a global jwt verifierACCESS_SCRIPT: User accessed a scriptACCESS_ALL_SCRIPTS: User accessed all scriptsCREATE_SCRIPT: User created a scriptUPDATE_SCRIPT: User updated a scriptDELETE_SCRIPT: User deleted a ScriptACCESS_SERVICES_GROUP: User accessed a service groupACCESS_ALL_SERVICES_GROUPS: User accessed all services groupsCREATE_SERVICE_GROUP: User created a service groupUPDATE_SERVICE_GROUP: User updated a service groupDELETE_SERVICE_GROUP: User deleted a service groupACCESS_SERVICES_FROM_SERVICES_GROUP: User accessed all services from a services groupACCESS_TCP_SERVICE: User accessed a tcp serviceACCESS_ALL_TCP_SERVICES: User accessed all tcp servicesCREATE_TCP_SERVICE: User created a tcp serviceUPDATE_TCP_SERVICE: User updated a tcp serviceDELETE_TCP_SERVICE: User deleted a tcp serviceACCESS_TEAM: User accessed a TeamACCESS_ALL_TEAMS: User accessed all teamsCREATE_TEAM: User created a teamUPDATE_TEAM: User updated a teamDELETE_TEAM: User deleted a teamACCESS_TENANT: User accessed a TenantACCESS_ALL_TENANTS: User accessed all tenantsCREATE_TENANT: User created a tenantUPDATE_TENANT: User updated a tenantDELETE_TENANT: User deleted a tenantSERVICESEARCH: User searched for a serviceACTIVATE_PANIC_MODE: Admin activated panic mode
-
Message: explicit message about the action (example: theSERVICESEARCHaction happened when anuser searched for a service) Content: all information at JSON format
Global metrics
The global metrics are displayed on the index page of the Otoroshi UI. Otoroshi provides information about :
- the number of requests served
- the amount of data received and sended
- the number of concurrent requests
- the number of requests per second
- the current overhead
More metrics can be found on the Global analytics page (available at https://xxxxxx/bo/dashboard/stats).
Monitoring services
Once you have declared services, you can monitor them with Otoroshi.
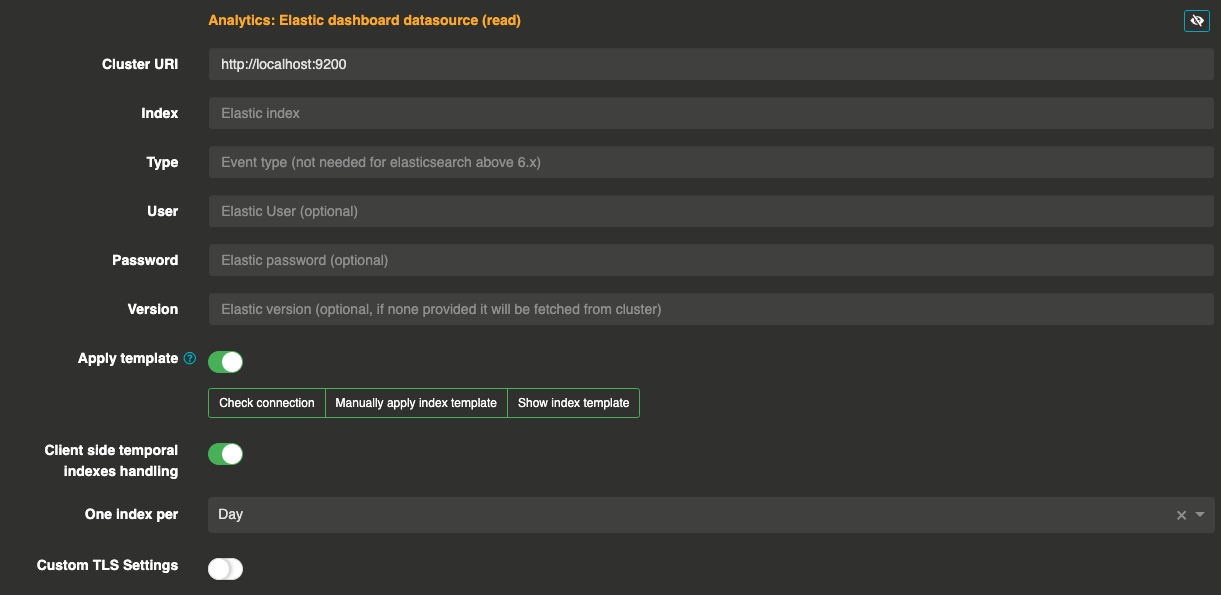
Let’s starting by setup Otoroshi to push events to an elastic cluster via a data exporter. Then you will can setup Otoroshi events read from an elastic cluster. Go to settings (cog icon) / Danger Zone and expand the Analytics: Elastic cluster (read) section.
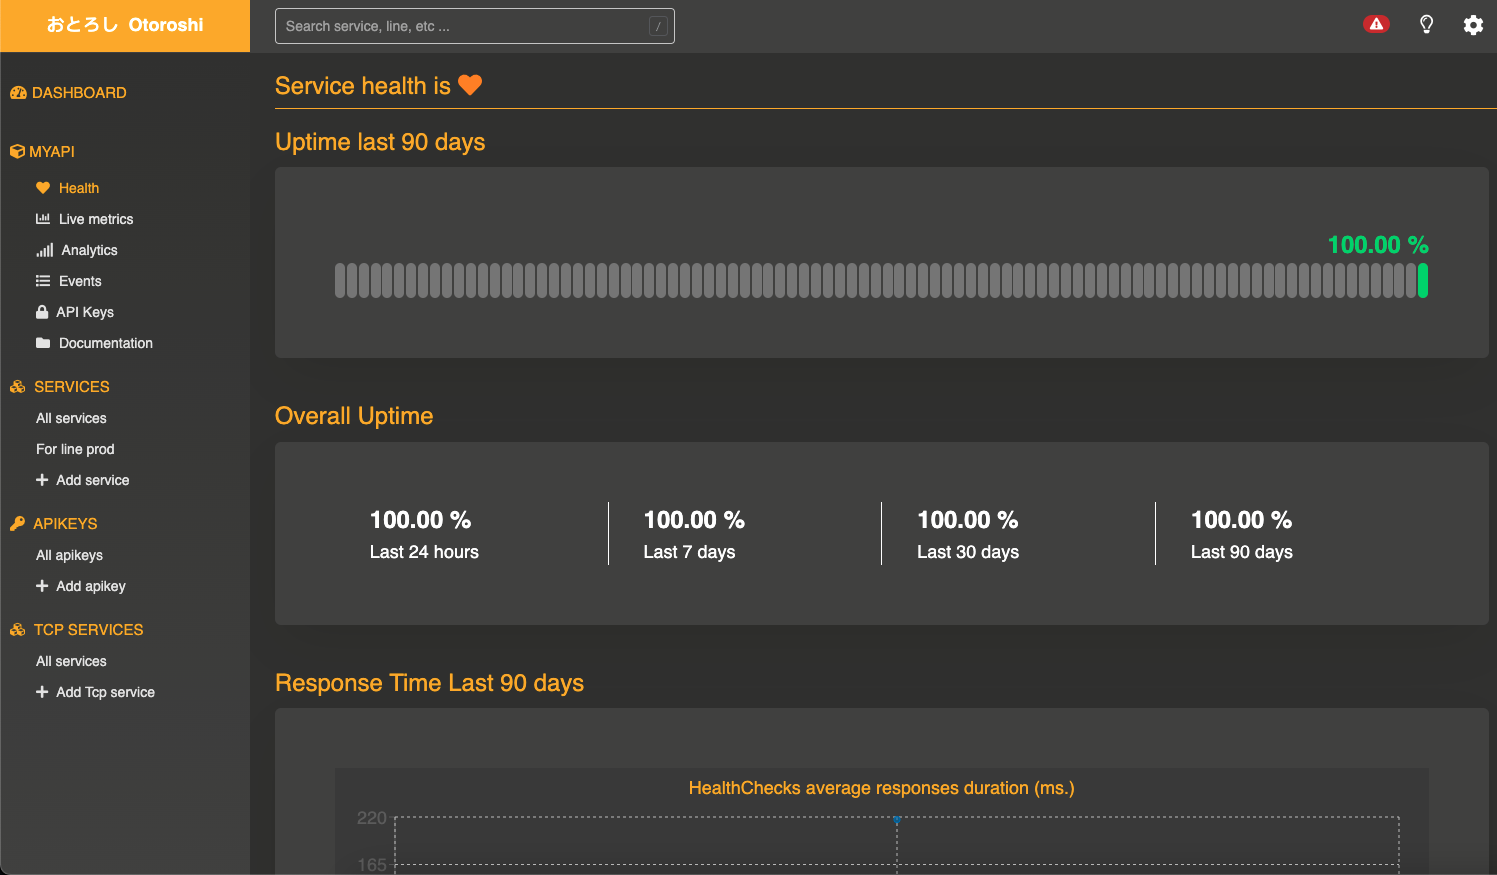
Service healthcheck
If you have defined an health check URL in the service descriptor, you can access the health check page from the sidebar of the service page.
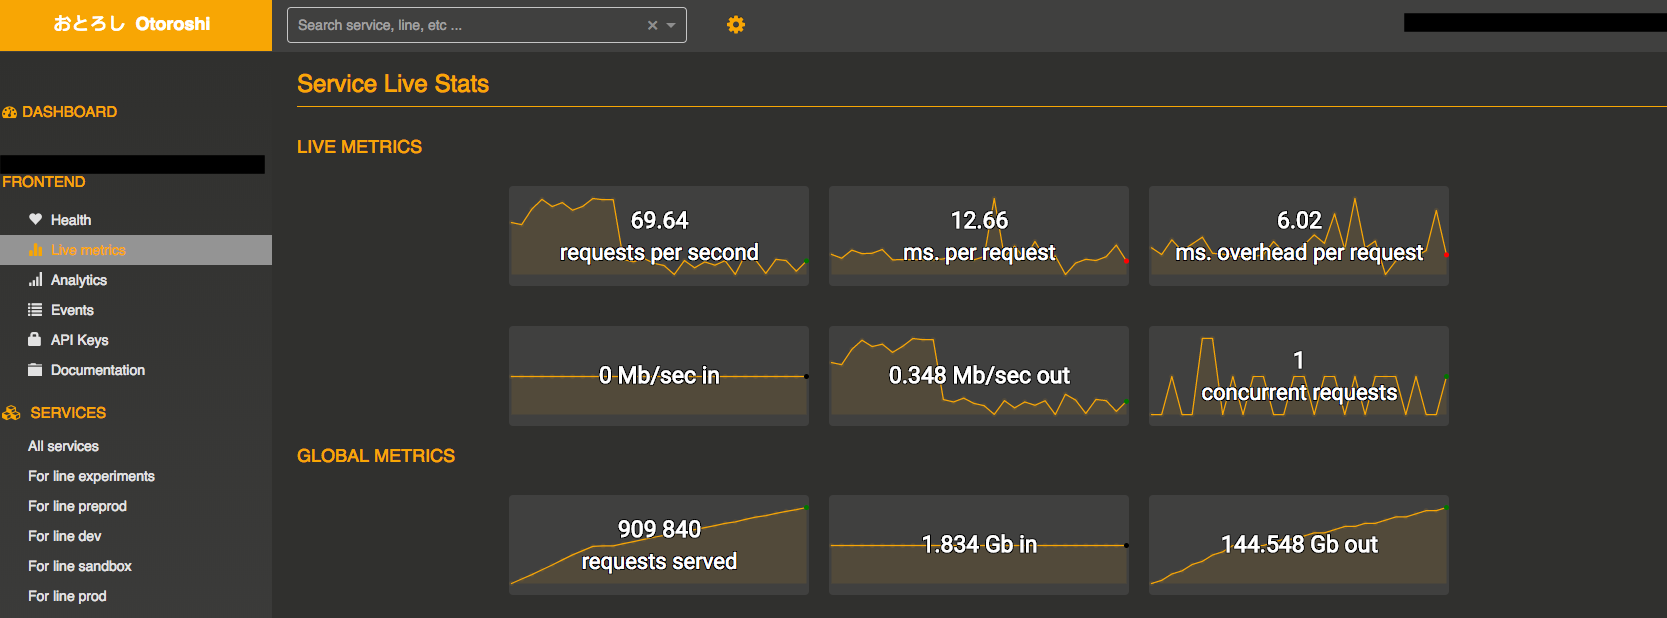
Service live stats
You can also monitor live stats like total of served request, average response time, average overhead, etc. The live stats page can be accessed from the sidebar of the service page.
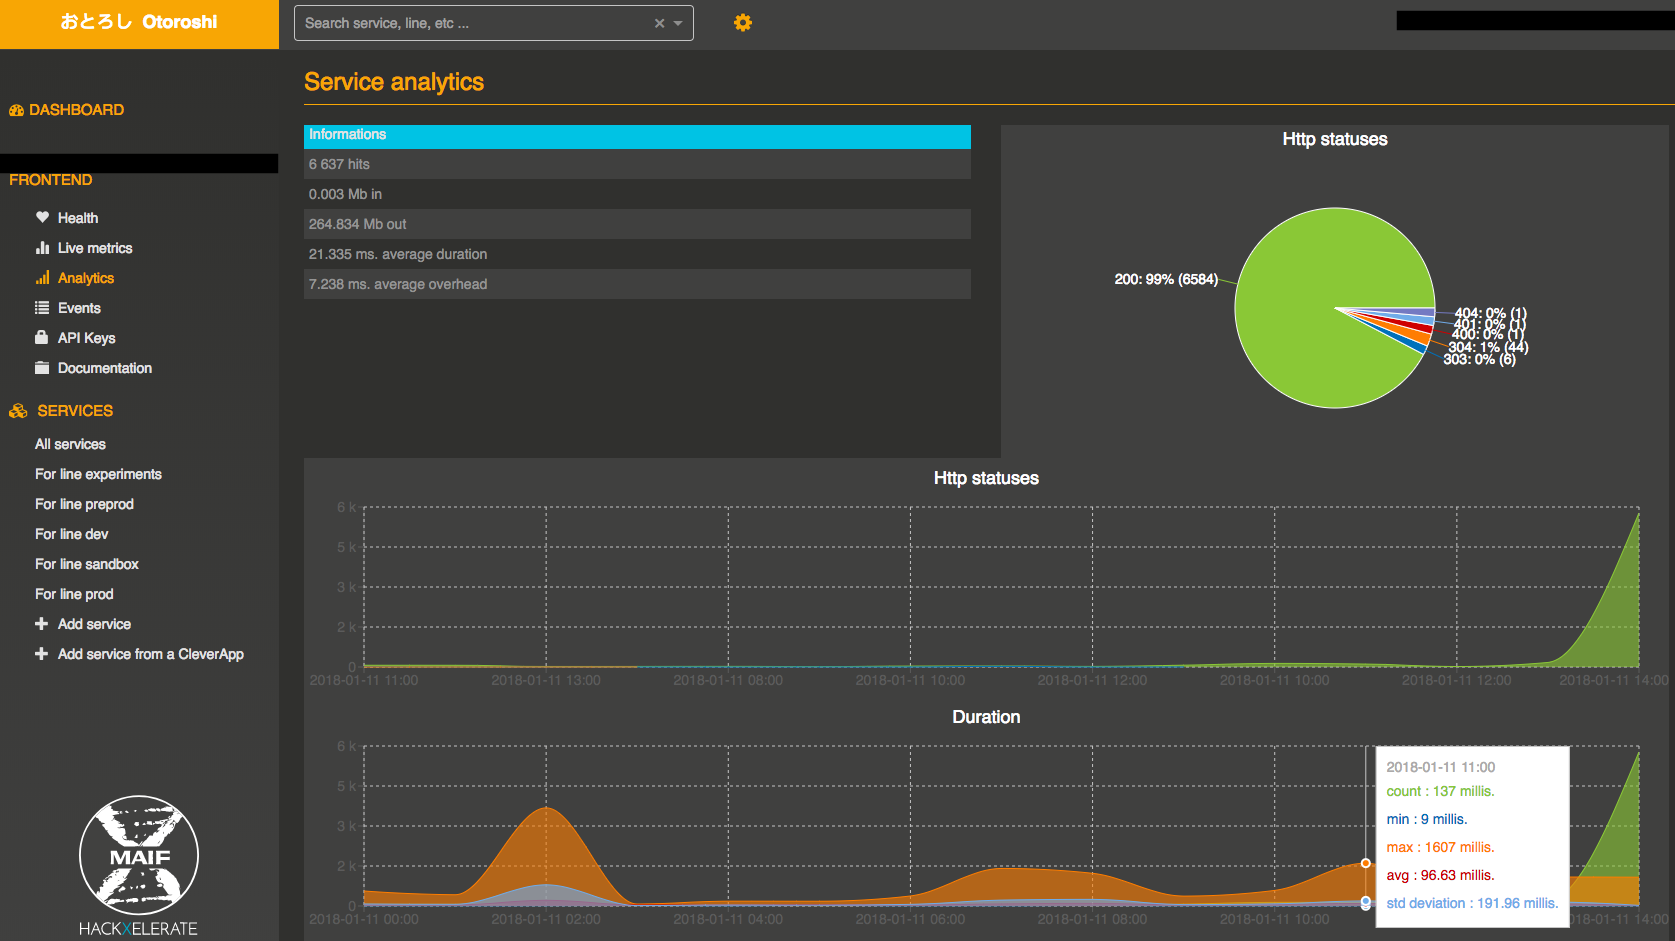
Service analytics
You can also get some aggregated metrics. The analytics page can be accessed from the sidebar of the service page.
New proxy engine
Debug reporting
when using the new proxy engine, when a route or the global config. enables traffic capture using the debug_flow flag, events of type RequestFlowReport are generated
Traffic capture
when using the new proxy engine, when a route or the global config. enables traffic capture using the capture flag, events of type TrafficCaptureEvent are generated. It contains everything that compose otoroshi input http request and output http responses