OpenTelemetry support
OpenTelemetry is an open-source project focused on providing a set of APIs, libraries, agents, and instrumentation to enable observability in modern software applications. It helps developers and software teams collect, process, and export telemetry data, which includes metrics, traces, and logs, from their applications and infrastructure. The project aims to provide a standardized approach to instrumenting applications for distributed tracing, metrics, and logging.
Here’s a breakdown of the key components of OpenTelemetry:
- Tracing: Distributed tracing is a method used to monitor and understand the flow of requests across different services in a distributed system. OpenTelemetry allows developers to add instrumentation to their code to trace requests as they flow through various services, providing insights into performance bottlenecks and dependencies between components.
- Metrics: Metrics are quantitative measurements that provide information about the behavior and performance of an application. OpenTelemetry enables developers to collect metrics from their applications, such as CPU usage, memory consumption, and custom application-specific metrics, to gain visibility into the application’s health and performance.
- Logging: OpenTelemetry also supports capturing and exporting logs, which are textual records of events and messages that occur during the execution of an application. Logs are essential for debugging and monitoring purposes, and OpenTelemetry allows developers to integrate logging with other telemetry data, making it easier to correlate events.
OpenTelemetry is designed to be language-agnostic and vendor-agnostic, supporting multiple programming languages and various telemetry backends. This flexibility makes it easier for developers to adopt the OpenTelemetry standard regardless of their technology stack.
The goal of OpenTelemetry is to promote a consistent way of collecting telemetry data across different applications and environments, making it easier for developers to adopt observability best practices. By leveraging OpenTelemetry, software teams can gain deeper insights into the behavior of their systems and improve performance, troubleshoot issues, and enhance the overall reliability of their applications.
Now, OpenTelemetry is officialy supported in Otoroshi and can be used in different parts of your instance. You can use it to collect otoroshi server logs and otoroshi server metrics through config. file. Then you have access to 2 new data exporter that can export otoroshi events to OpenTelemetry log collector and send custom metrics to an OpenTelemetry metrics collector.
server logs
otoroshi server logs can be sent to an OpenTelemetry log collector. Everything is configured throught the config. file and can be overloaded through env. variables, and -D jvm flags.
first you need to set the otoroshi.open-telemetry.server-logs.enabled flag to true and then configure the remote connection through endpoint, timeout, gzip and grpc. You can also enabled mTLS through client_cert and trusted_cert that are otoroshi certificates id references. Finally you can use max_duration to specify the logs push interval.
otoroshi {
  ...
  open-telemetry {
    server-logs {
      enabled = false
      enabled = ${?OTOROSHI_OPEN_TELEMETRY_SERVER_LOGS_ENABLED}
      gzip = false
      gzip = ${?OTOROSHI_OPEN_TELEMETRY_SERVER_LOGS_GZIP}
      grpc = false
      grpc = ${?OTOROSHI_OPEN_TELEMETRY_SERVER_LOGS_GRPC}
      endpoint = ${?OTOROSHI_OPEN_TELEMETRY_SERVER_LOGS_ENDPOINT}
      timeout = 5000
      timeout = ${?OTOROSHI_OPEN_TELEMETRY_SERVER_LOGS_TIMEOUT}
      client_cert = ${?OTOROSHI_OPEN_TELEMETRY_SERVER_LOGS_CLIENT_CERT}
      trusted_cert = ${?OTOROSHI_OPEN_TELEMETRY_SERVER_LOGS_TRUSTED_CERT}
      headers = ${?OTOROSHI_OPEN_TELEMETRY_SERVER_LOGS_HEADERS}
      max_duration = ${?OTOROSHI_OPEN_TELEMETRY_SERVER_LOGS_MAX_DURATION}
    }
    ...
  }
  ...
}
server metrics
otoroshi server metrics can be sent to an OpenTelemetry metrics collector. Everything is configured throught the config. file and can be overloaded through env. variables, and -D jvm flags.
first you need to set the otoroshi.open-telemetry.server-metrics.enabled flag to true and then configure the remote connection through endpoint, timeout, gzip and grpc. You can also enabled mTLS through client_cert and trusted_cert that are otoroshi certificates id references. Finally you can use max_duration to specify the metrics push interval.
otoroshi {
  ...
  open-telemetry {
    server-metrics {
      enabled = false
      enabled = ${?OTOROSHI_OPEN_TELEMETRY_SERVER_METRICS_ENABLED}
      gzip = false
      gzip = ${?OTOROSHI_OPEN_TELEMETRY_SERVER_METRICS_GZIP}
      grpc = false
      grpc = ${?OTOROSHI_OPEN_TELEMETRY_SERVER_METRICS_GRPC}
      endpoint = ${?OTOROSHI_OPEN_TELEMETRY_SERVER_METRICS_ENDPOINT}
      timeout = 5000
      timeout = ${?OTOROSHI_OPEN_TELEMETRY_SERVER_METRICS_TIMEOUT}
      client_cert = ${?OTOROSHI_OPEN_TELEMETRY_SERVER_METRICS_CLIENT_CERT}
      trusted_cert = ${?OTOROSHI_OPEN_TELEMETRY_SERVER_METRICS_TRUSTED_CERT}
      headers = ${?OTOROSHI_OPEN_TELEMETRY_SERVER_METRICS_HEADERS}
      max_duration = ${?OTOROSHI_OPEN_TELEMETRY_SERVER_METRICS_MAX_DURATION}
    }
    ...
  }
  ...
}
logs data expoter
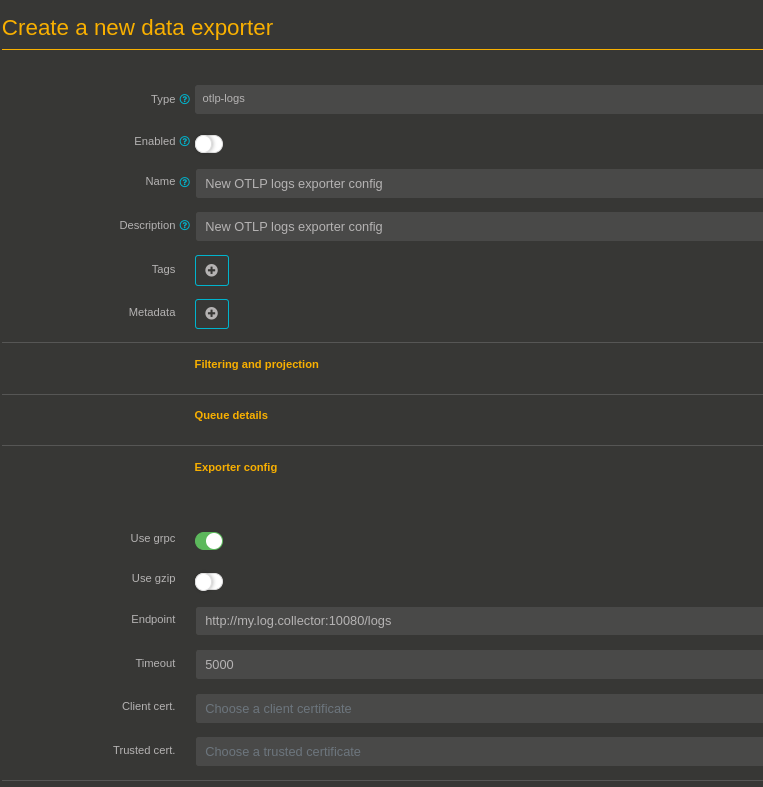
A new kind of data exporter is now available to send otoroshi events serialized as text to an OpenTelemetry log collector. First create a new data exporter and select the type otlp-logs. Then fill the filter and projection part as needed. In the exporter config. section, fill the collectors endpoint, timeout, gzip and grpc flags, enable mTLS through client_cert and trusted_cert.
metrics data exporter
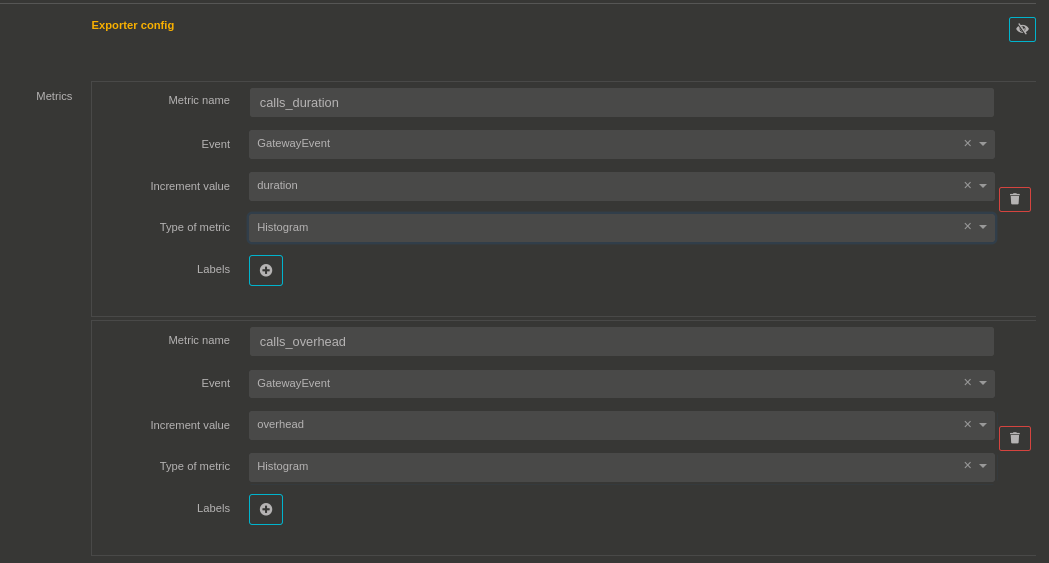
A new kind of data exporter is now available to send custom metrics derived from otoroshi events to an OpenTelemetry metrics collector. First create a new data exporter and select the type otlp-metrics. Then fill the filter and projection part as needed. In the exporter config. section, fill the collectors endpoint, timeout, gzip and grpc flags, enable mTLS through client_cert and trusted_cert.
Then you will be able to add new metrics on this data exporter with a name, the type of metric (counter, timer, histogram), the value and the kind of event it’s based on.