User Analytics & Dashboards - live observability, natively inside Otoroshi

For a long time, getting a clear picture of what was actually happening on your gateway meant plugging Otoroshi into an external observability stack -- Elastic, Kafka, Grafana, you name it -- then maintaining yet another set of dashboards, queries and alert rules far away from where your routes and APIs actually live.
We thought this should be a lot simpler. So we built User Analytics & Dashboards: a complete analytics stack that lives directly inside Otoroshi, on top of a dedicated PostgreSQL data exporter, with curated queries, a beautiful grid of widgets and a threshold-based alert engine. No external stack to plug, no extra UI to learn.
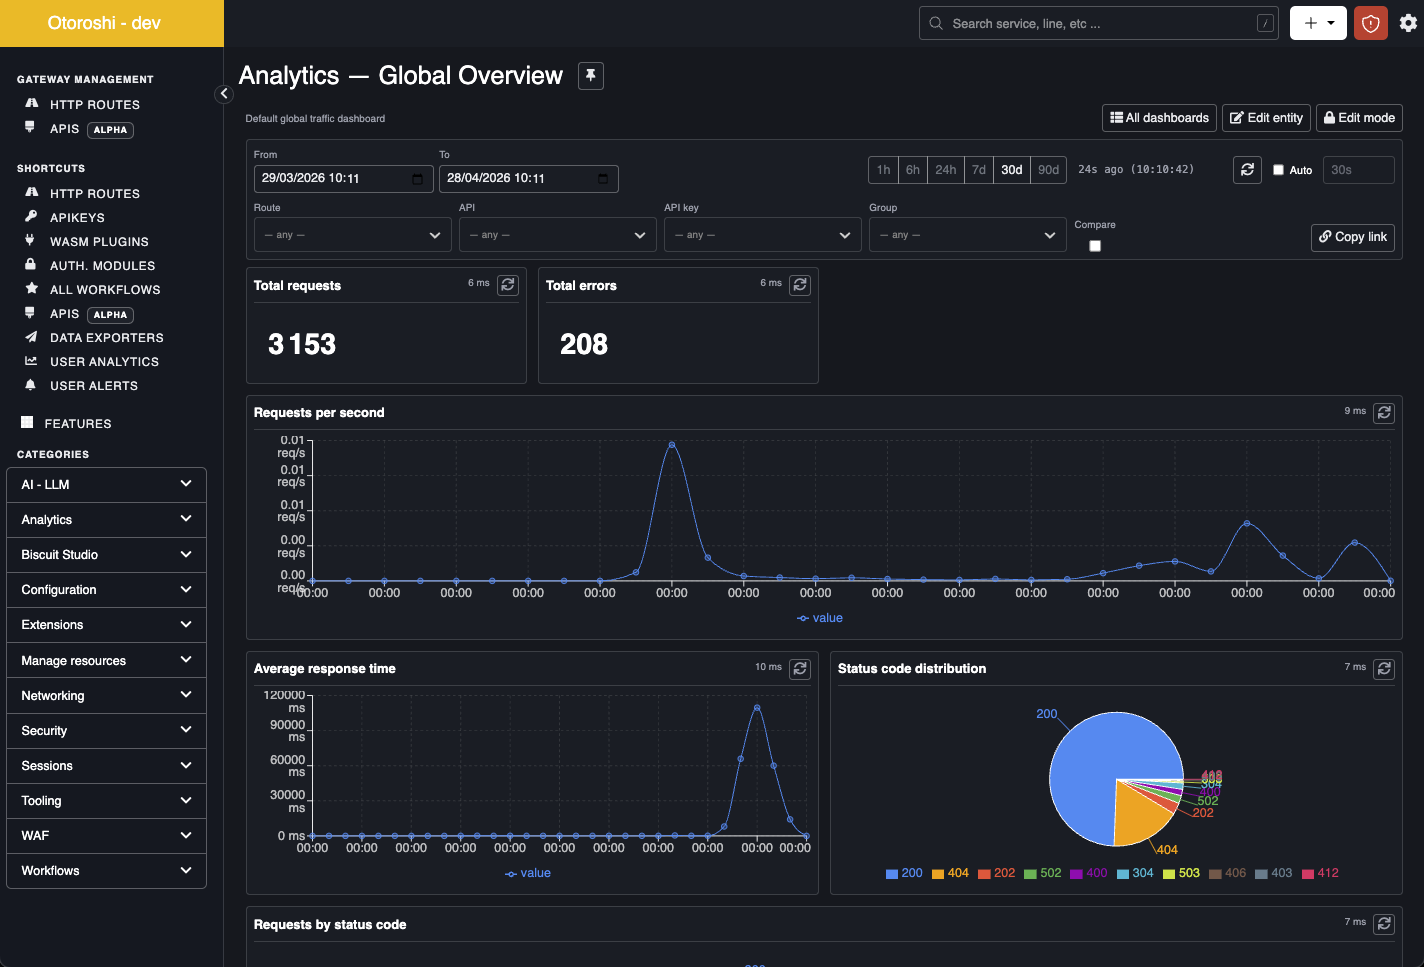
Built where your gateway already lives
The whole feature is designed around one idea: the people who configure routes, APIs and API keys in Otoroshi are also the ones who need to see how that traffic behaves -- and they should not have to leave the product to do it.
Concretely, that means:
- A PostgreSQL data exporter dedicated to analytics events, with the schema, indexes and alert log table created automatically
- A catalogue of curated queries -- volume, performance, errors, top consumers -- ready to plot or alert on
- A grid of widgets (line, area, bar, pie, donut, big number, table, heatmap) with a point-and-click editor and drag-and-drop reordering
- A threshold alert engine that rides on the same query catalogue, with conditions, AND/OR logic, severities, cooldown and a full event log
- Everything tenant-scoped, so each team only sees its own traffic
Five default dashboards are seeded for you the moment you mark the PostgreSQL exporter as active: a Global Overview, plus dashboards focused on Performance, Errors, APIs & Routes and Consumers. You can use them as-is, fork them or build your own from scratch.
Three minutes to go live
There are really only three steps to get going:
- Plug a PostgreSQL store. Go to Data Exporters → Add → User Analytics (PostgreSQL), fill in the connection details, set a retention window, save.
- Mark it as the active analytics exporter. From that moment on, every gateway event flows into your store.
- Open the dashboards under Features → Analytics → User Analytics.
That's it -- you are live, with five dashboards already showing real traffic.
A dashboard editor built for iteration
Every dashboard ships with an Edit mode that unlocks a small toolbar. From there, adding a widget is a matter of picking a query from the catalogue, choosing the visual style and dropping it on the grid. Widths and heights are adjustable, format hints (count, req/s, ms, bytes, percent) are auto-suggested but always overridable, and reordering is pure drag-and-drop.
A few touches we are particularly happy with:
- Save view as default: capture the current time range, filters and refresh interval as the dashboard's opening view -- anyone clicking the dashboard from the menu lands on that exact configuration
- Drill-down on click: click a route, API or API key in any top-N chart and the whole dashboard reroutes onto that entity
- Deep links: every filter and time range lives in the URL, so a copied link reproduces the exact same view on the other side
- Compare period overlay on time series, for one-click week-over-week or day-over-day checks
- Auto-refresh at the cadence you want, paused automatically when the tab is hidden
The query catalogue covers volume (total / per second, by status, by method, traffic in/out), performance (averages, p50/p75/p95/p99, overhead, latency heatmap), errors (rate, top failing routes) and top consumers (routes, APIs, API keys, end users, domains, countries). Every query supports the same filters -- route, API, API key, group, time window -- so you can scope any of them to a specific slice of your traffic.
And because Otoroshi extensions can register their own analytics queries, anything you build on top of the gateway -- a WAF, an MCP integration, a billing module -- can contribute its own queries that appear in the widget picker and the alert conditions editor with no extra wiring.
Alerts, on the same queries
Once you have a dashboard you trust, the natural next step is "tell me when this widget looks bad". That's exactly what the alert engine does: it rides on the same query catalogue your dashboards use, so anything you can plot, you can alert on.
Creating an alert is a small form: a name, a severity (info / warning / critical), a time window, and one or more conditions. Each condition is a one-liner -- "take query error_rate_ts, reduce with max, fire if the result is greater than 0.05" -- with an optional scope on a specific route, API, API key or group. Conditions are combined with AND/OR logic in a visual editor, with a JSON view always one click away for power users.

You also get the boring-but-essential knobs you actually need in production: an evaluation interval to control how often the alert is re-checked, a cooldown to avoid spamming, and a window to control how far back the condition looks.
Where do alerts go? Through the standard Otoroshi alert pipeline. Every firing emits a recognizable AlertEvent (signature alert: "UserAnalyticsAlert"), which means any Otoroshi data exporter can deliver it -- mailer for email, webhooks for PagerDuty / Opsgenie / Slack, Kafka for a downstream pipeline, a custom WASM exporter for anything bespoke. The User Alerts page even reminds you to plug one the first time you create an alert and offers a one-click shortcut that pre-fills the filter.
Every firing is also persisted in a per-alert event log, with severity, message and a snapshot of which conditions matched (observed value vs configured threshold). You can mark events as seen one by one, or wipe the inbox with a single Mark all seen.
Tenant-aware by design
Multi-tenancy was a non-negotiable from day one. A tenant-admin sees only the traffic, dashboards, alerts and events of their own tenant -- the SQL filter is injected at the data layer, so one tenant's data physically never leaks into another's query. Super-admins switch tenants from the usual dropdown, and the analytics views follow.
Dashboards and alerts are first-class Otoroshi entities, so they participate in your existing export / import / GitOps workflows. Want to ship a dashboard from staging to production? Same flow as any other entity.
Why this matters
There is a reason most teams end up with a separate observability stack: building this kind of feature is real work. But the cost of running a separate stack is also real -- another product to deploy, another query language, another set of credentials, another place where the data model drifts from your gateway's reality.
User Analytics tries to close that gap. The queries know about your routes, APIs and API keys because they live in the same database as your gateway events. The alert conditions reference exactly the queries you are already plotting. The export pipeline is the same one you already use for emails, Slack or webhooks. It's one product to learn, configured once.
Where to next
- Try it now: head to Data Exporters → Add → User Analytics (PostgreSQL), then to Features → Analytics → User Analytics.
- Read the full guide: the User Analytics topic covers every widget, every query and every knob in detail.
- Share what you build: if you assemble a dashboard or an alert recipe that you think other teams would benefit from, ping us on Discord -- we'd love to feature it.
We've been using these dashboards internally for a while now, and it's hard to imagine going back to flipping between Otoroshi and an external tool just to know how the gateway is doing. We hope you'll feel the same.