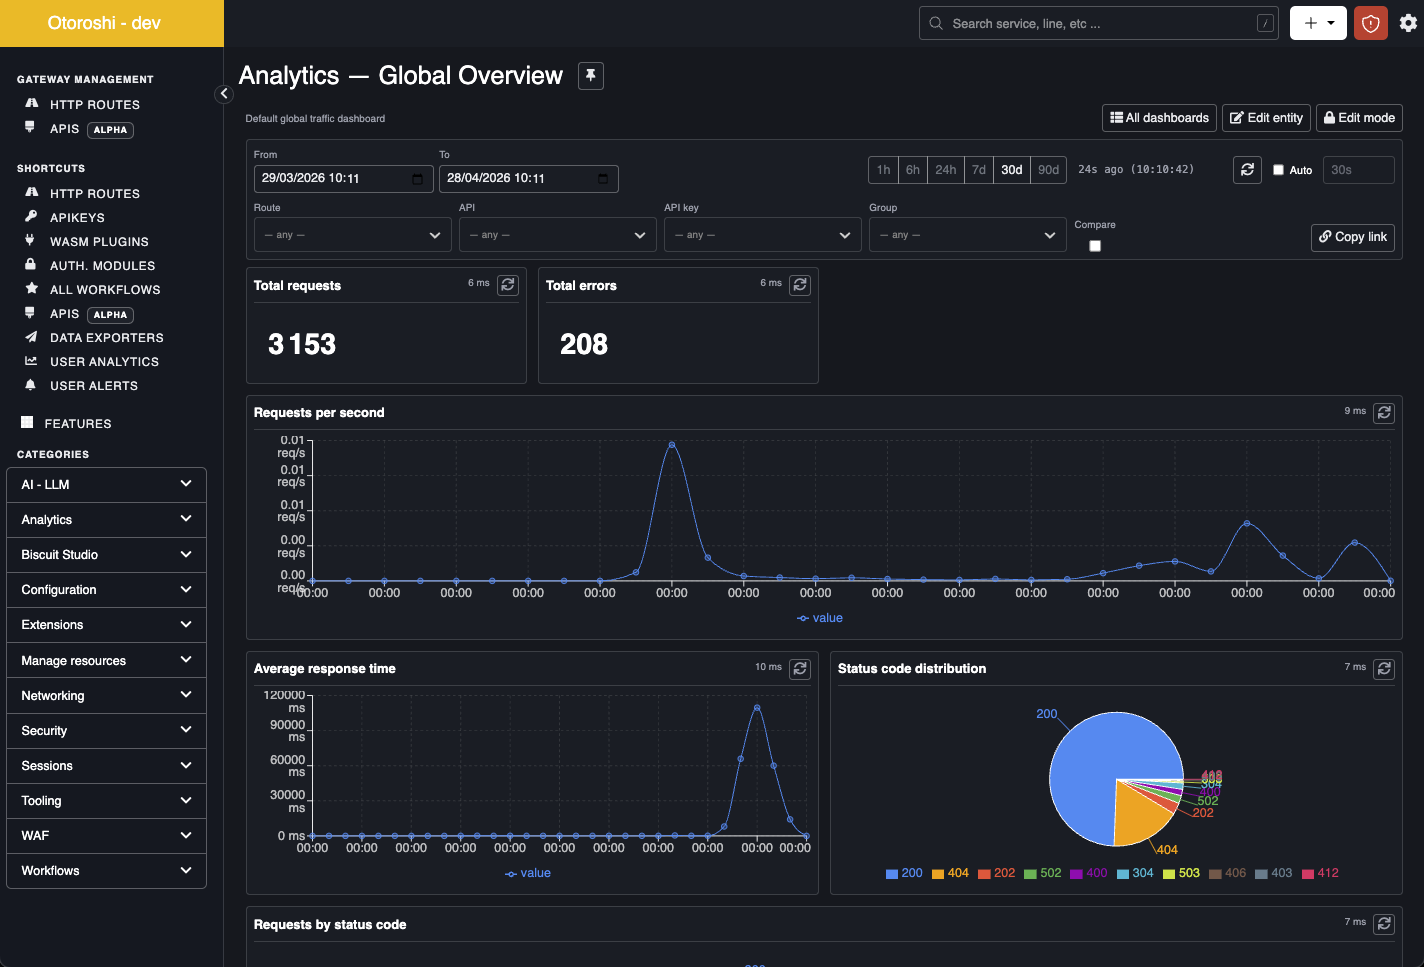
User Analytics & Dashboards - live observability, natively inside Otoroshi
· 7 min read

For a long time, getting a clear picture of what was actually happening on your gateway meant plugging Otoroshi into an external observability stack -- Elastic, Kafka, Grafana, you name it -- then maintaining yet another set of dashboards, queries and alert rules far away from where your routes and APIs actually live.
We thought this should be a lot simpler. So we built User Analytics & Dashboards: a complete analytics stack that lives directly inside Otoroshi, on top of a dedicated PostgreSQL data exporter, with curated queries, a beautiful grid of widgets and a threshold-based alert engine. No external stack to plug, no extra UI to learn.